braz

Friday, December 24, 2010

A quiet day and some statistical fun

I recently enjoyed the slides from Peter Aldhous on "Data-Driven Journalism", he is the San Francisco bureau chief for the New Scientist magazine and knows a thing or three about this topic. It follows similar comments from Tim Berners-Lee on the topic. It is becoming increasingly more popular to use tools like R to explore these datasets, take this Mexican mortality example for instance.

On the Irish side, we are slowly getting places. It is more thanks to efforts by individuals such as Gavin Sheridan of TheStory.IE that Freedom of Information (FOI) requests are being made to explore the dark areas of the public sector that could do with a little more clarity given the times we are now in.

This spurred me to put together a short little R example (Source code on GitHub) exploring just a fraction of this data for the Mid-West region.
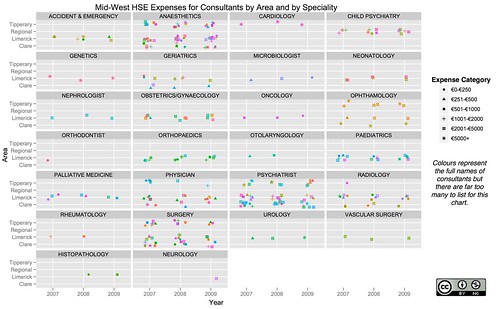
MidWestHSEConsultantsExample

On the flip side of this post, I'll raise my hand and say that my new job has been keeping me very busy indeed. However, if this kind of thing is something you would like to see or hear more about for a commercial opportunity then my team and I at the Irish Center for High End Computing can help. Take a look at the kinds of data analytic services we offer and you can see I've spent even more time in R in the last year!

Labels: , , ,

Monday, December 28, 2009

R for Global Wind Wave / Wave Swell Forecasting

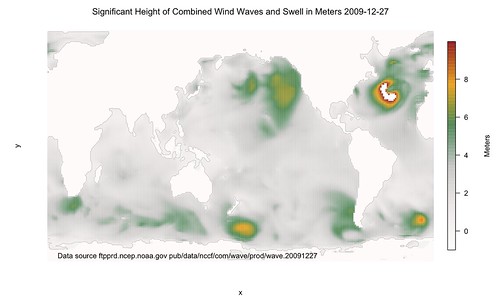
As a follow up to using freely available existing climate datasets, here's one that might be of interest to those surfers and sailors out there. It is similar approach to that used for the temperature forecasting so go read that post first, it will help.

The free information from the U.S. NOAA/National Weather Service's National Centers for Environmental Prediction, in particular its Environmental Modeling Center and its WaveWatch dataset. It is stored as a GRIB2 files and this needs to be pre-processed using wgrib2 (available on MacPorts) to the netcdf format. This stage is similar to the previous post.

There were a few little glitches with this dataset that are immediately visible and the fact there is a big white patch in the Atlantic is due to the maximum height being stored as 9.999e+20. This normally won't be a problem but unfortunately the data also stores dry land with this value. A workaround would be to know or compute longitudes and latitude such that we could tell if a given position was over land or over sea prior to processing it. Unfortunately as this is a bit of a quick and dirty hack, I didn't have the time so here is the basic approach warts and all.

# See http://www.nco.ncep.noaa.gov/pmb/products/wave/nww3.t00z.grib.grib2.shtml
# Data was from ftp ftpprd.ncep.noaa.gov dir: /pub/data/nccf/com/wave/prod/wave.20091227
# wgrib2 was installed using macports
# /opt/local/bin/wgrib2 -s nww3.t00z.grib.grib2 | grep "HTSGW:surface:an" | /opt/local/bin/wgrib2 -i nww3.t00z.grib.grib2 -netcdf WAVE.nc

library(ncdf)
waveFrac <- open.ncdf("WAVE.nc")
wave <- get.var.ncdf(waveFrac, "HTSGW_surface")
# Dirty hack to fix input model, look for another better solution
wave[wave>9.99999]<- -1
x <- get.var.ncdf(waveFrac, "longitude")
y <- get.var.ncdf(waveFrac, "latitude")
library(fields)
rgb.palette <- colorRampPalette(c("snow1","snow2","snow3","seagreen","orange","firebrick"), space = "rgb")
image.plot(x,y,wave,col=rgb.palette(255),axes=F,main=as.expression(paste("Significant Height of Combined Wind Waves and Swell in Meters 2009-12-27", sep="")),legend.lab="Meters")
# Add a rough outline for islands, countries, and continents
contour(x,y,wave,add=TRUE,lwd=0.25,levels=0.2,drawlabels=FALSE,col="grey30")
# Add the source of the file and ftp location
text(130,-75,"Data source ftpprd.ncep.noaa.gov pub/data/nccf/com/wave/prod/wave.20091227")


NWW3WindWaves2009122700UTC

Labels: , , , ,

Tuesday, December 22, 2009

R for Global Climate forecasting

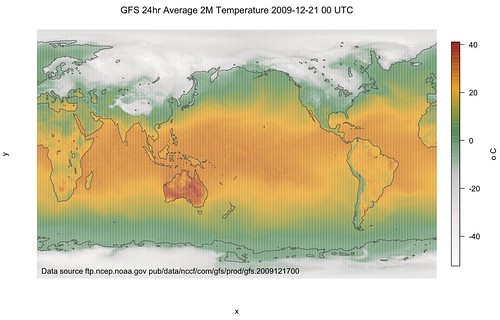
Joe has a great post on using R for exploiting existing climate datasets to create some really nice weather maps. Using the free information from the U.S. National Centers for Environmental Prediction (NCEP) Global Forecast System (GFS), he shows how R can be used to interpret GRIB2 files after they are pre-processed using wgrib2 (available on MacPorts) to the netcdf format.

I've slightly modified the code from Joe but its pretty much as he wrote it.
# ftp.ncep.noaa.gov pub/data/nccf/com/gfs/prod/gfs.2009121700
# See http://www.nco.ncep.noaa.gov/pmb/products/gfs/gfs.t00z.sfluxgrbf00.grib2.shtml
# eoin-brazils-macbook-pro:~ eoinbrazil$ cp gfs.t00z.sfluxgrbf03.grib2 temp2.grb
# wgrib2 was installed using macports
# /opt/local/bin/wgrib2 -s temp2.grb | grep ":LAND:" | /opt/local/bin/wgrib2 -i temp2.grb -netcdf LAND2.nc
# /opt/local/bin/wgrib2 -s temp2.grb | grep ":TMP:2" | /opt/local/bin/wgrib2 -i temp2.grb -netcdf TEMP2.nc

library(ncdf)
landFrac2 <- open.ncdf("LAND2.nc")
land2 <- get.var.ncdf(landFrac2, "LAND_surface")
x <- get.var.ncdf(landFrac2, "longitude")
y <- get.var.ncdf(landFrac2, "latitude")
library(fields)
rgb.palette <- colorRampPalette(c("snow1","snow2","snow3","seagreen","orange","firebrick"), space = "rgb")
tempFrac2 <- open.ncdf("TEMP2.nc")
temp2 <- get.var.ncdf(tempFrac2, "TMP_2maboveground")
newtemp2 <- temp2-273.15 # Convert the kelvin records to celsius
image.plot(x,y,newtemp2,col=rgb.palette(200),axes=F,main=as.expression(paste("GFS 24hr Average 2M Temperature 2009-12-21 00 UTC",sep="")),legend.lab="o C")
contour(x,y,land2,add=TRUE,lwd=1,levels=0.99,drawlabels=FALSE,col="grey30") #add land outline
text(120,-85,"Data source ftp.ncep.noaa.gov pub/data/nccf/com/gfs/prod/gfs.2009121700")


The image continues to show cold conditions in Europe, and the continuing heatwave in Australia.
GFS24hr2MTMP2009122100UTC

Labels: , , ,

Thursday, November 19, 2009

Following recent Infomaps with R trend - Visualizing Irish unemployment rates with a choropleth map

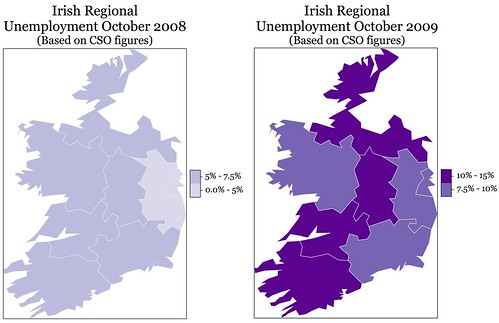
Following on the recent trend of InfoMaps from Flowing Data and a call to R users to attempt their own examples. I saw this lovely German visualization with R and decided it was time to do Ireland.

IrishUnemploymentOct08toOct09

Looking at these images, I'm reminded of the lyrics of the song "What a Difference A Day Made", the one that goes like
What a difference a day made,
Twenty-four little hours,
Brought the sun and the flowers,
Where there used to be rain...

Labels: , , , ,

Wednesday, July 25, 2007

Installing / Upgrading R thru a http proxy on OS X

Having upgraded my version of R to 2.5.1, I was intent on not having to go home and upgrade my packages but I have always had some troubles getting the http_proxy to work on OS X for R in UL. After following a few fruitless suggestions from the web, I finally stumbed upon the correct way that works for UL.

1) Open Terminal and do the following:
export http_proxy=http://staff-proxy.ul.ie:8080
export HTTP_PROXY=http://staff-proxy.ul.ie:8080

2) Run R and do the following:
Sys.setenv(http_proxy="http://staff-proxy.ul.ie:8080")
double-check this with:
Sys.getenv("http_proxy")

It should work happily now, I think the major problem is you need to export the items in Terminal before running R.

Labels: , ,