braz

Sunday, October 04, 2009

Playing with R to animate SBP / RedC polling data

Another quiet afternoon so I had a look at the excellent site, "From Data to Graphics" and came up with this little animation showing the last three years of Sunday Business Post polls results with the last general election results.

SBP/RedC Sep 06 to Sep 09

Labels:

Saturday, October 03, 2009

Visualising Lisbon 2009 and 2008 by constituency

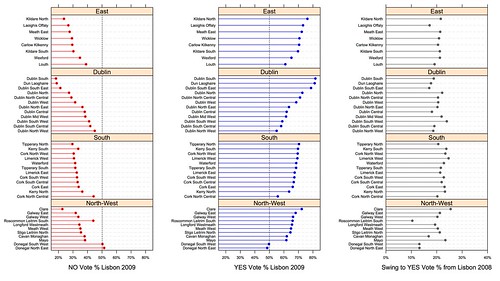
The results are in. Lisbon 2 has been passed by Ireland. Voting results are available Irish Election, from RTE, and the IT. I've added a couple of visualisations using dot plots to help show where it all changed from last year.

The 2009 Lisbon Referendum Ireland voting results by region and constituency.
Lisbon2009Results

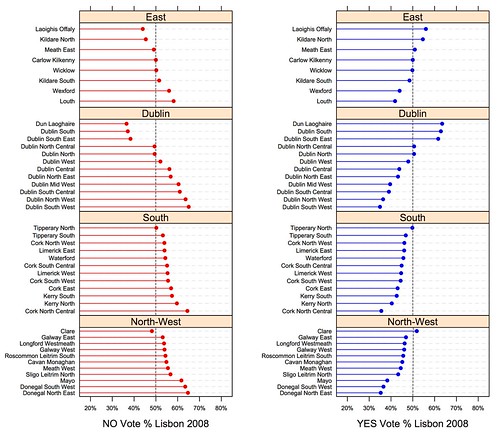
Here are the 2008 results for comparison.
Lisbon2008Results

Labels: , ,

Sunday, September 27, 2009

Lisbon Red C Polling 2009 Dot Plots

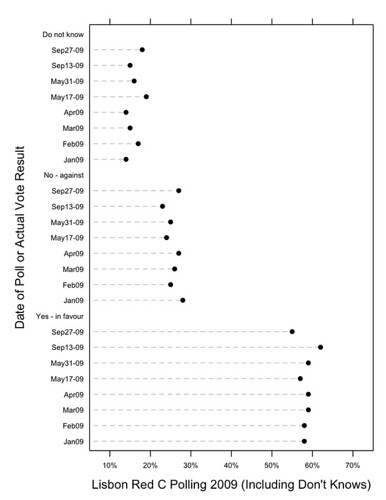
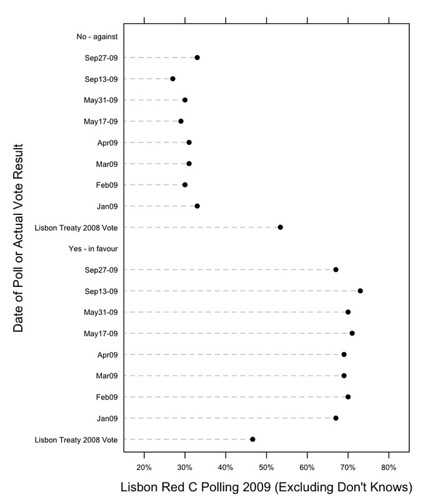
I've been playing around with R and dot plots. Today's SBP poll from RedC was a prefect excuse to have some fun.


LisbonRedCPolling2009-IncludingDontKnows
Originally uploaded by bluepelican


LisbonRedCPolling2009-ExcludingDontKnows
Originally uploaded by bluepelican

Labels: , ,