A quiet day and some statistical fun
I recently enjoyed the slides from Peter Aldhous on "Data-Driven Journalism", he is the San Francisco bureau chief for the New Scientist magazine and knows a thing or three about this topic. It follows similar comments from Tim Berners-Lee on the topic. It is becoming increasingly more popular to use tools like R to explore these datasets, take this Mexican mortality example for instance.
On the Irish side, we are slowly getting places. It is more thanks to efforts by individuals such as Gavin Sheridan of TheStory.IE that Freedom of Information (FOI) requests are being made to explore the dark areas of the public sector that could do with a little more clarity given the times we are now in.
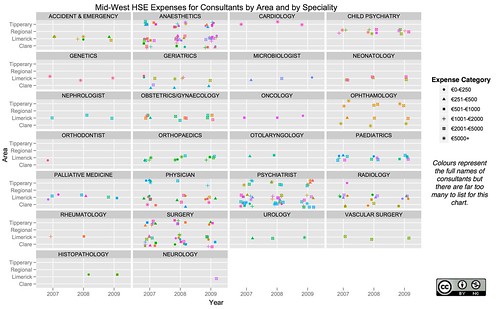
This spurred me to put together a short little R example (Source code on GitHub) exploring just a fraction of this data for the Mid-West region.
On the flip side of this post, I'll raise my hand and say that my new job has been keeping me very busy indeed. However, if this kind of thing is something you would like to see or hear more about for a commercial opportunity then my team and I at the Irish Center for High End Computing can help. Take a look at the kinds of data analytic services we offer and you can see I've spent even more time in R in the last year!
On the Irish side, we are slowly getting places. It is more thanks to efforts by individuals such as Gavin Sheridan of TheStory.IE that Freedom of Information (FOI) requests are being made to explore the dark areas of the public sector that could do with a little more clarity given the times we are now in.
This spurred me to put together a short little R example (Source code on GitHub) exploring just a fraction of this data for the Mid-West region.
On the flip side of this post, I'll raise my hand and say that my new job has been keeping me very busy indeed. However, if this kind of thing is something you would like to see or hear more about for a commercial opportunity then my team and I at the Irish Center for High End Computing can help. Take a look at the kinds of data analytic services we offer and you can see I've spent even more time in R in the last year!
Labels: HSE, Irish Data Driven Journalism, R, theStory
posted by Eoin Brazil at
8:46 p.m.
|
0 comments
![]()